
Most teaching licenses will require that you pass a certification exam with math concepts. Thoughts of this test often induce fear and stress in even the most talented prospective teachers. Ensuring that you have a deep understanding of the math fundamentals will alleviate this anxiety and help you pass your exam. One topic that many struggle with is graphing linear equations. Let’s review the basics.
Linear equations make straight lines when graphed. The equations can all be written in the format y = mx + b, where m is the slope and b is the y-intercept. The slope describes how slanted the line is and the y-intercept is the point where the line will cross the y-axis.
On these certification exams, you may see a couple problems where you are asked to match a graph to an equation. Here is one possible approach.
- Start by determining whether the slope is positive or negative.
If you are looking at a graph, if the line goes up when looking at it from left to right, then it has a positive slope. If the line goes down, it has a negative slope. Once you determine the sign of the slope, look at the equation when it is in the form y=mx+b and determine whether the m has the same sign. See if you can eliminate any answer choices. - Find the y-intercept.
The next easiest thing to identify about a linear graph is the y-intercept. Look at the y-axis (the vertical one) and determine the point where the line crosses the x-axis (the horizontal one). Compare this value to the y-intercept in the equation that is represented by the variable b. See if any answer choices can be eliminated. - Determine the slope.
Pick any two points on the line and write down their coordinates. Then, figure out the slope by calculating the rise over the run or the change in y over the change in x. Find the difference in the y-values divided by the difference in the x-values. This slope is represented by m in the standard equation, y = mx + b. Using the slope and y-intercept, find your answer.
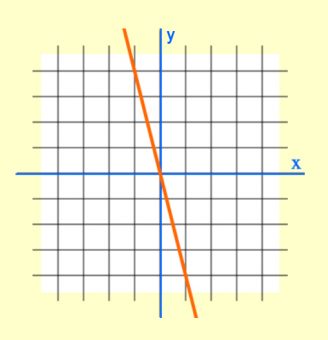
If after following this approach you still have two or more viable options, you can always try different points. Remember, a graph represents all the points that make the equation true. If you are struggling, just pick a point on the graph and plug the coordinates into the equation. If the equation does not work for a coordinate pair that is graphed, then that equation can’t represent the graph.
I hope you find some helpful tips in this quick review of graphing linear equations. We have full-length comprehensive teacher prep courses for all topics on your teacher certification exams if you need help preparing. Best of luck.